- Ashish Sasidharan
- September 5, 2024
Top UVM Debugging Hacks that will transform your workflow
1. Introduction
Debugging within the Universal Verification Methodology (UVM) framework can often feel like a daunting, time-consuming task. With complex testbenches, identifying and resolving issues can significantly slow down the verification process. But fear not! With the right strategies and tools, you can streamline your debugging workflow and make it more efficient and effective.
In this blog post, we’ll share some UVM debugging hacks that will dramatically improve the way you work. Whether you’re a seasoned verification engineer or a newcomer to UVM, these tips and tricks will help you save time and improve the overall quality of your verification efforts. Let’s dive in and unlock the secrets to more effective UVM debugging!
Visibility into the test bench architecture, TLM ports, configuration items, synchronization flow and transaction types will help identify where the problem is originating from. The rest of the blog will explain how this visibility can be provided
2. Testbench Debug:
In UVM (Universal Verification Methodology), ensuring the correct creation and connection of components is fundamental to building a reliable testbench. This process involves understanding the UVM component hierarchy, verifying TLM (Transaction-Level Modeling) connections, and debugging factory and configuration settings.
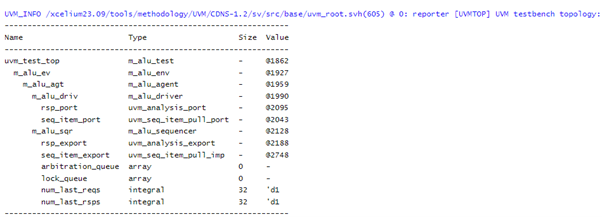
2.1 Print the Testbench Topology
It helps to inspect the connections and components check whether they are instantiated and connected properly.
2.1.1 From tb_top module:
If enable_print_topology is set, then the entire testbench topology is printed just after completion of the end_of_elaboration phase. Avoid calling print_topology before run_test as it’s too early.

2.1.2 From the uvm_test class

2.2 Debugging TLM Connections
If the print_topology is not enough to debug the TLM connection. Understanding the intricacies of TLM connections is crucial for efficient system design and verification.
Let’s delve into the essential techniques that will help you identify and resolve issues in TLM connections with ease.
debug_connected_to : Outputs a visual text display of the port/export/imp network to which this port connects (i.e., the port’s fanout).
debug_provided_to : Outputs a visual display of the port/export network that ultimately connects to this port (i.e., the port’s fanin).
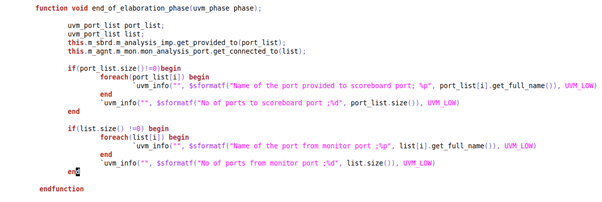
get_provided_to : Fills a list with all ports, exports, and implementations that this port provides its implementation to.
get_connected_to : Fills list with all of the ports, exports and implementations that this port is connected to.
Eg


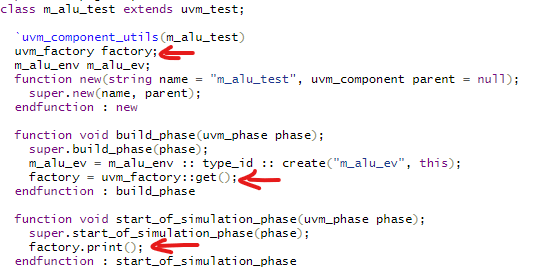
2.3 Debugging the Factory
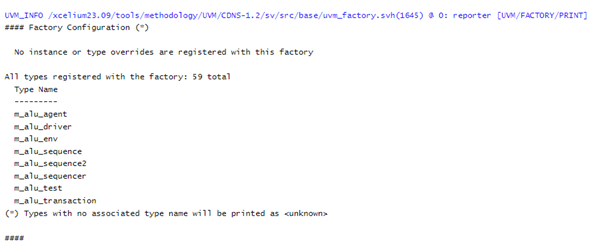
Displays the current state of the uvm_factory, detailing the registered types, instance-specific overrides, and type-specific overrides.
Log:
2.4 Configuration Database Debug
The uvm_config_db class provides a convenient interface on top of the uvm_resource_db to simplify the basic interface that is used for configuring uvm_component instances.
This helps in maintaining a centralized configuration management system, making it easier to control and modify testbench parameters.
Debugging uvm_config_db involves identifying and resolving issues related to the setting and getting of configuration values.
2.4.1 Key Methods for Debugging:
1. Enable CONFIG_DB__TRACE via Command Line: Displays all configuration DB accesses (read and write).

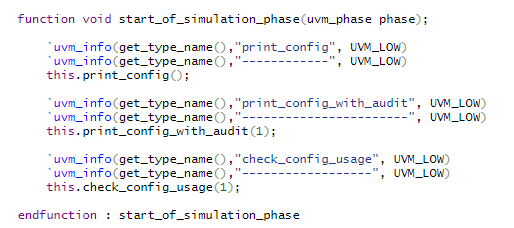
2. Use Built-in uvm_component Configuration Interface Functions:
[i] print_config(); – Prints settings for one component.
[ii] print_config(1); – Includes all children.
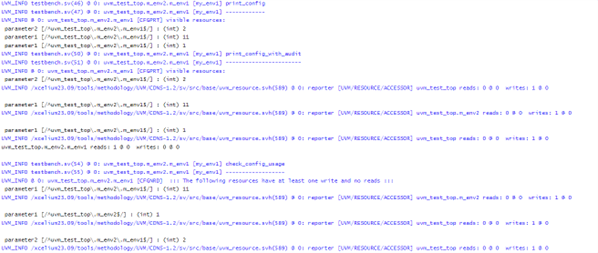
[iii] print_config_with_audit(); – Prints setters and getters.
[iv] check_config_usage(); – Prints calls to set() without get().
uvm_config_db :: set


uvm_config_db :: get

Log:
3. Synchronization Debug
3.1 Objection Mechanism:
Allows components to communicate their status and coordinate the end of test phases.
3.1.1 Trace Objections:
Use the +UVM_OBJECTION_TRACE command line option to log all objection raises and drops.


3.1.2 Debugging Objections with Heartbeats:
The uvm_heartbeat monitors component activity and detects potential deadlocks or hang states.
Heartbeat Modes:
UVM_ALL_ACTIVE: Every component must have a heartbeat.
UVM_ANY_ACTIVE: Some component must have a heartbeat.
UVM_ONE_ACTIVE: Exactly one component must have a heartbeat.
Example:
Success case:
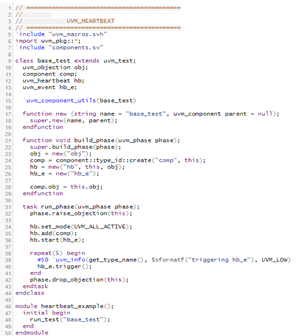
In the following example, the component comp remains continuously active because an objection is raised every 40 time-units, and a heartbeat event is triggered every 50 time-units.
Loop delays for
comp: 40 time-units
hb_e: 50 time-units
Therefore, each time a heartbeat event occurs, it detects activity on the comp component. This ensures the simulation concludes without any FATAL errors.
Fail case:
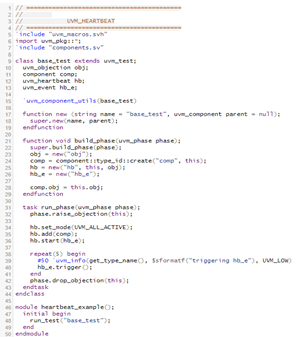
Component comp is active till 120 time-units as an objection is raised after every 40 time-units for three times and heartbeat event is triggered after every 50 time-units for five times
Loop delays for
comp: 40 time-units
hb_e: 50 time-units
After 120 time-units, the heartbeat event no longer detects activity on the comp component. Specifically, there is no activity between the heartbeat events occurring at 150 and 200 time-units. Consequently, the heartbeat monitor issued an HBFAIL FATAL error and terminated the simulation.
Success Case

Fail Case

Simulator Log:
Success Case

Fail Case

3.2 Phase Tracing
The +UVM_PHASE_TRACE option logs the start and end of each phase, helping users understand the sequence and timing of phase executions.

4. Stimulus Debug
The +UVM_PHASE_TRACE option logs the start and end of each phase, helping users understand the sequence and timing of phase executions.
4.1 Print and Sprint
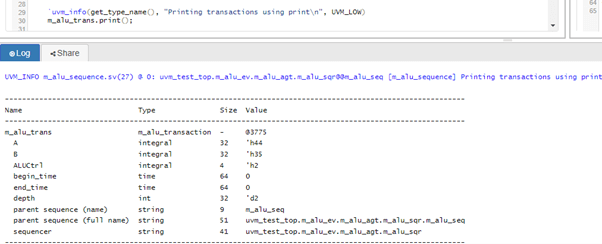
print: Quickly display the contents of an object to the console or log.
sprint: Get the contents as a string for further processing.
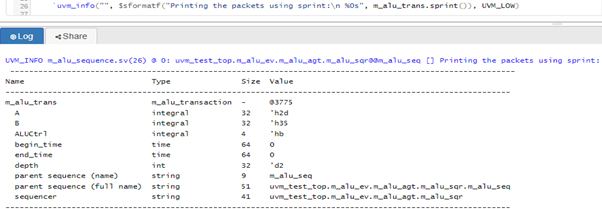
The only difference between the print() and sprint(), is that sprint() formats its output to a string.
4.2 UVM Reporting Mechanism
- Add `__FILE and `__LINE to find file and line number from where a print was issued aides in debug.
- Improve efficiency of verbosity checks.
- By default, report with verbosity > UVM_MEDIUM are suppressed.
- Severity
Severity indicates importance.
Examples are Fatal, Error, Warning & Info - Verbosity
Verbosity indicates filter level.
Examples are None, Low, Medium, High, Full & Debug - Simulation Handling Behaviour
Simulation handling behaviour controls simulator behaviour
Examples are Exit, Count, Display, Log & No Action
4.2.1 Debug Verbosity Levels
> UVM_NONE = 0
> UVM_LOW = 100
> UVM_MEDIUM = 200 (Default)
> UVM_HIGH = 300
> UVM_FULL = 400
> UVM_DEBUG = 500
4.2.2 Setting Actions
> UVM_NO_ACTION: Suppress other actions.
> UVM_DISPLAY: Standard output.
> UVM_LOG: Redirect to log file.
> UVM_COUNT: Abort simulation on reaching count.
> UVM_EXIT: Abort simulation.
> UVM_STOP: Call $stop.
> UVM_RM_RECORD: Send report to recorder.
4.2.3 Report macros and its usage
UVM Reporting offers macros for embedding report messages. The following macros should be used
- `uvm_info(string ID, string MSG, verbosity);
- `uvm_error(string ID, string MSG);
- `uvm_warning(string ID, string MSG);
- `uvm_fatal(string ID, string MSG);
Severity | Default Action |
UVM_INFO | UVM_DISPLAY |
UVM_WARNING | UVM_DISPLAY |
UVM_ERROR | UVM_DISPLAY | UVM_COUNT |
UVM_FATAL | UVM_DISPLAY | UVM_EXIT |
Examples of setting the action in increasing order of priority
set_report_severity_action(UVM_INFO, UVM_DISPLAY);
set_report_id_action(“Sample”, UVM_LOG);
set_report_severity_id_action(UVM_WARNING, “Sample”, UVM_LOG | UVM_DISPLAY);
4.3 Reports within sequences
4.3.1 Reporting using `uvm_info_context macro
`uvm_info_context – Gives control over scope reported in message.
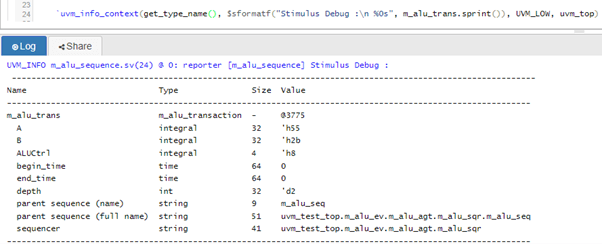
4.3.2 Reporting using `uvm_info macro
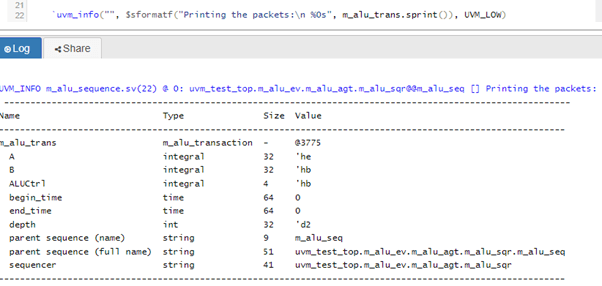
4.4 Generation of separate debug log file
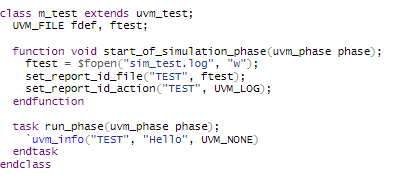
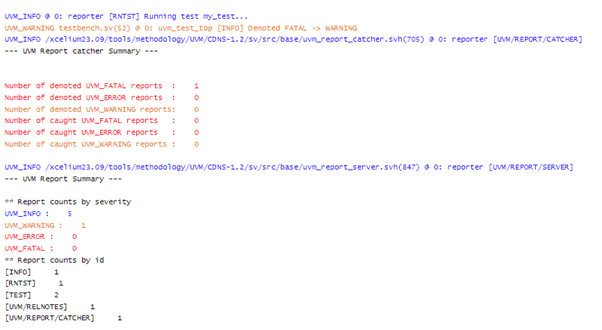
4.5 Report Catch Messages
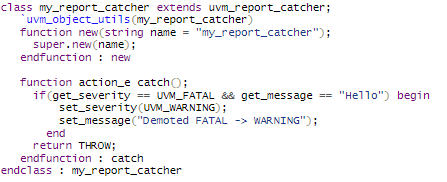
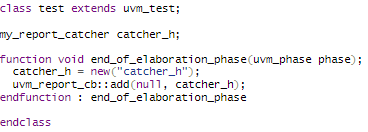
4.5.1 Registering report catchers
